This site uses cookies to improve your experience. To help us insure we adhere to various privacy regulations, please select your country/region of residence. If you do not select a country, we will assume you are from the United States. Select your Cookie Settings or view our Privacy Policy and Terms of Use.
Cookie Settings
Cookies and similar technologies are used on this website for proper function of the website, for tracking performance analytics and for marketing purposes. We and some of our third-party providers may use cookie data for various purposes. Please review the cookie settings below and choose your preference.
Used for the proper function of the website
Used for monitoring website traffic and interactions
Cookie Settings
Cookies and similar technologies are used on this website for proper function of the website, for tracking performance analytics and for marketing purposes. We and some of our third-party providers may use cookie data for various purposes. Please review the cookie settings below and choose your preference.
Strictly Necessary: Used for the proper function of the website
Performance/Analytics: Used for monitoring website traffic and interactions
NaturalGas Inventories as of May 30, 2025 The EIA has released its naturalgas inventory report, showing a net increase of 122 Bcf as of May 30, 2025. Working gas in storage was 2,598 Bcf as of Friday, May 30, 2025, according to EIA estimates. Midwest 579 541 38 38 684 -15.4 Salt 340 328 12 12 329 3.3
NaturalGas Inventories as of May 23, 2025 The EIA has released its naturalgas inventory report, showing a net increase of 101 Bcf as of May 23, 2025. Working gas in storage was 2,476 Bcf as of Friday, May 23, 2025, according to EIA estimates. Midwest 541 512 29 29 657 -17.7 Salt 328 321 7 7 324 1.2
NaturalGas Inventories as of May 16, 2025 The EIA has released its naturalgas inventory report, showing a net increase of 120 Bcf as of May 16, 2025. Working gas in storage was 2,375 Bcf as of Friday, May 16, 2025, according to EIA estimates. Midwest 512 480 32 32 632 -19.0 Salt 321 308 13 13 318 0.9
NaturalGas Inventories as of May 9, 2025 The EIA has released its naturalgas inventory report, showing a net increase of 110 Bcf as of May 9, 2025. Working gas in storage was 2,255 Bcf as of Friday, May 9, 2025, according to EIA estimates. Midwest 480 454 26 26 610 -21.3 Mountain 185 180 5 5 195 -5.1
exports of liquefied naturalgas (LNG) represent the largest source of naturalgas demand growth this year. billion cubic feet per day (Bcf/d) in 2025 and by 15% to 16.4 Bcf/d in 2026. According to the U.S. Energy Information Administration (EIA), U.S. LNG gross exports are expected to increase by 19% to 14.2
NaturalGas Inventories as of April 25, 2025 The EIA has released its naturalgas inventory report, showing a net increase of 107 Bcf as of April 25, 2025. Working gas in storage was 2,041 Bcf as of Friday, April 25, 2025, according to EIA estimates. Midwest 425 396 29 29 562 -24.4
NaturalGas Inventories as of April 18, 2025 The EIA has released its naturalgas inventory report, showing a net increase of 88 Bcf as of April 18, 2025. Working gas in storage was 1,934 Bcf as of Friday, April 18, 2025, according to EIA estimates. Midwest 396 373 23 23 548 -27.7
NaturalGas Inventories as of April 11, 2025 The EIA has released its naturalgas inventory report, showing a net increase of 16 Bcf as of April 11, 2025. Working gas in storage was 1,846 Bcf as of Friday, April 11, 2025, according to EIA estimates. Midwest 373 373 0 0 526 -29.1
NaturalGas Inventories as of April 4, 2025 The EIA has released its naturalgas inventory report, showing a net increase of 57 Bcf as of April 4, 2025. Working gas in storage was 1,830 Bcf as of Friday, April 4, 2025, according to EIA estimates. Midwest 373 364 9 9 512 -27.1
NaturalGas Inventories as of March 28, 2025 The EIA has released its naturalgas inventory report, showing a net increase of 29 Bcf as of March 28, 2025. Working gas in storage was 1,773 Bcf as of Friday, March 28, 2025, according to EIA estimates. Midwest 364 367 -3 -3 513 -29.0
NaturalGas Inventories as of March 21, 2025 The EIA has released its naturalgas inventory report, showing a net increase of 37 Bcf as of March 21, 2025. Working gas in storage was 1,744 Bcf as of Friday, March 21, 2025, according to EIA estimates. Midwest 367 366 1 1 531 -30.9
NaturalGas Inventories as of March 14, 2025 The EIA has released its naturalgas inventory report, showing a net increase of 9 Bcf as of March 14, 2025. Working gas in storage was 1,707 Bcf as of Friday, March 14, 2025, according to EIA estimates. Midwest 366 370 -4 -4 552 -33.7
NaturalGas Inventories as of February 28, 2025 The EIA has released its naturalgas inventory report, showing a net decrease of 80 Bcf as of February 28, 2025. Working gas in storage was 1,760 Bcf as of Friday, Februrary 28, 2025, according to EIA estimates. Midwest 396 424 -28 -28 582 -32.0
NaturalGas Inventories as of March 7, 2025 The EIA has released its naturalgas inventory report, showing a net decrease of 62 Bcf as of March 7, 2025. Working gas in storage was 1,698 Bcf as of Friday, March 7, 2025, according to EIA estimates. Midwest 370 396 -26 -26 563 -34.3
marketed naturalgas production remained “relatively flat in 2024,” according to the U.S. Gas production last year grew “by less than 0.4 billion cubic feet per day (Bcf/d) compared with 2023 to average 113 Bcf/d,” according to EIA’s latest NaturalGas Monthly report.
(Oil & Gas 360) – Electricity Data For The Month Of March Highlights Why Many Are Likely To Soon Be Caught Very NaturalGas Short More energy needed to power the much needing to be done had 3.2% The quantity of electricity fueled by naturalgas set new record highs 9 of the last 12 months (Figure 2.
Compressor Station 165 in Pittsylvania County (in southern Virginia) is part of the Transco pipeline network, the nations largest-volume interstate naturalgas pipeline system.
Rover Pipeline, a 713-mile naturalgas pipeline, was designed to carry up to 3.25 billion cubic feet per day (Bcf/d) of Marcellus and Utica gas from Pennsylvania, West Virginia, and Ohio to destinations in Ohio, Michigan, West Virginia, and Canada.
The Marcellus/Utica region is the United States’ top naturalgas production area, accounting for about one-third of the country’s daily output. Naturalgas production in the M-U has soared from 2 Bcf/d (billion cubic feet per day) to over 33 Bcf/d today in the past 15 years.
A few weeks ago, MDN told you that EQT Corporation, the second-largest naturalgas producer in the country (and the largest producer in the Marcellus/Utica) is buying out and merging in Olympus Energy for $1.8 billion (see EQT Buying Olympus Energy for $1.8 Billion; 90K Acres, 0.5 Olympus uses another company, Leviathan Energy, to.
Naturalgas has been pivotal to keeping millions of Americans safely and affordably warm throughout these winter storms. Typically, the colder it is, the more naturalgas America requires. Naturalgas has a few unique characteristics that make it so well suited to be the background of our energy system.
Energy Market Assessment: Restoringupward mobility of the masses will have a profitable oil & gas drilling boom- oil and gas 360 While many are worried about stock market volatility, interest rates, tariffs and other uncertainty, The Climate Changing to stimulating is driving our bullish naturalgas outlook.
Bcf/d of incremental naturalgas supplies to the Texas/Louisiana Gulf Coast. During the same period, more than 8 Bcf/d of new LNG export capacity will move that gas to international markets. The impact of this onslaught of gas flows will be anything but orderly. Inflows will never equal outflows.
The Marcellus/Utica region is by far the most prolific naturalgas production area in the U.S., The shale play experienced phenomenal growth in the 2010s, its gas production rising from less than 2 Bcf/d to more than 33 Bcf/d over that decade. accounting for about one-third of the nations daily output.
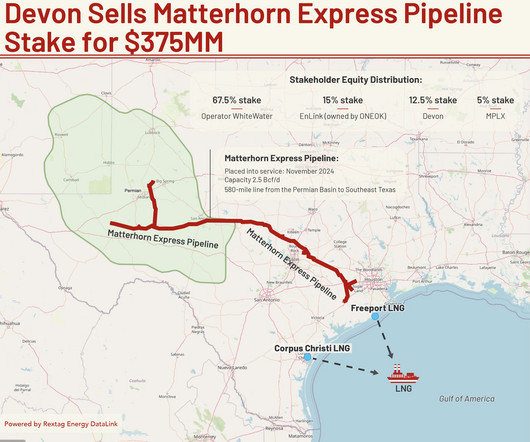
Last year, Enbridge struck a deal to buy three naturalgas utilities in the United States from Dominion Energy for a total consideration of $14 billion. The expansion of Enbridges gas business also paid off in the first quarter of the year. In the naturalgas transmission business, Enbridge sanctioned the 1.75
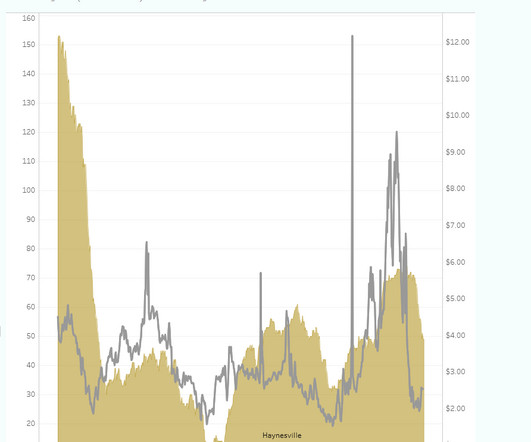
According to EIR, the high volatility in naturalgas prices expected at East Texas hubs served by Haynesville production is driven by timing mismatches related to gas supply, pipeline development and LNG export demand. There could be as much as 6 Bcf/d of underutilized pipeline capacity over the next decade in the Haynesville.
Denver-based Tallgrass said last week it completed anchor shipper agreements for a new pipeline that will transport naturalgas from multiple points in the Permian Basin to the Rockies Express pipeline and other points of delivery. Target in-service date is late 2028. Pipeline capacity is designed for up to 2.4
billion, with 91% tied to naturalgas. Meanwhile, Kinder Morgans LNG transport contracts are already locked and loaded: 7 Bcf/d now, expected to hit 11 Bcf/d by 2027. The companys pipeline backlog now tops $8.8 That includes chunky new projects like the $1.6 billion Trident line and the $1.7 Kinder didnt blink.
is entering the cold season with the largest naturalgas storage inventories since 2016, putting downward pressure on power forward prices across much of the country. Key Numbers to Watch NaturalGas Storage: 3,922 Bcf (6% above five-year average). 2024 Gas Injections: 1,640 Bcf (21% below five-year average).
This output includes more than 10 BCF/d of naturalgas [Read more] The widespread adoption of horizontal drilling and multi-stage hydraulic fracturing around 2010 transformed it from a modest resource into a powerhouse, now producing over 2,000,000 boe/d.
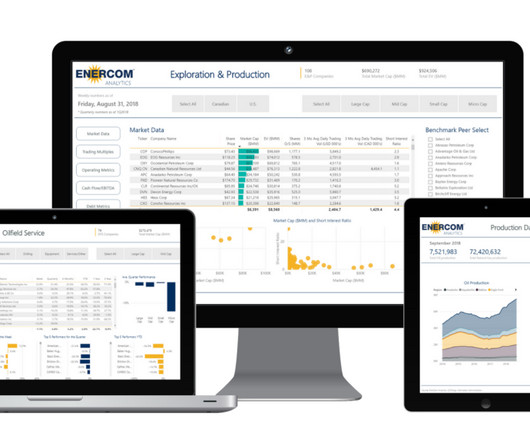
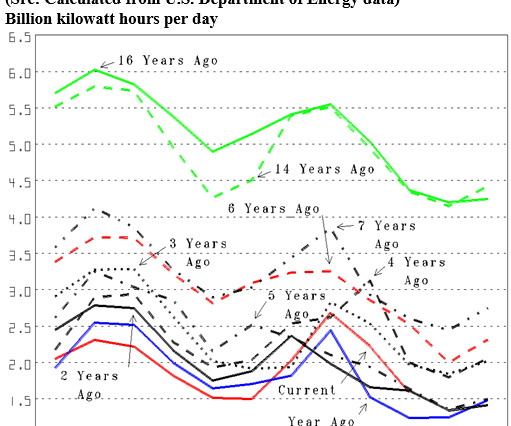
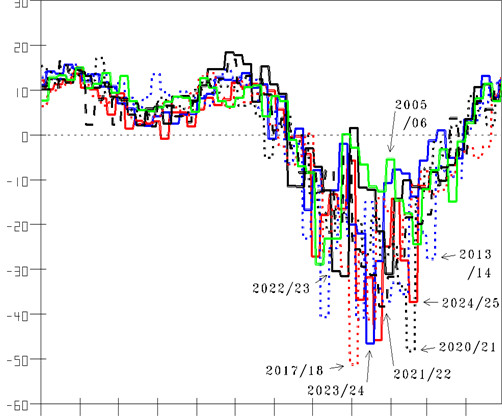
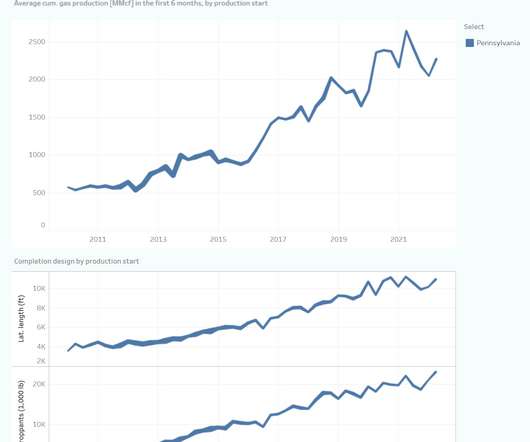
Visit the blog to explore the full interactive dashboard These interactive presentations contain the latest gas (and a little oil). This article contains still images from the interactive dashboards available in the original blog post. To follow the instructions in this article, please use the interactive dashboards.
The plant will leverage naturalgas and CCUS to produce 1 Bcf/d of blue hydrogen and 1 mtpa of low-carbon ammonia. EIR) is a subsidiary of Enverus that publishes energy-sector research focused on the oil, naturalgas, power and renewable industries. Enverus Intelligence | Research, Inc.
billion project spanning 216 miles, designed to enhance naturalgas transportation between Katy, Texas, and the Gulf Coasts LNG and industrial hub near Port Arthur. Bcf/d and is set to commence operations in the first quarter of 2027, pending regulatory approvals. Bcf/d capacity project. Bcf/d capacity project.
billion cubic feet (BCF) naturalgas and 66.5 million barrels (MMBBL) condensate/naturalgas liquids (NGL) net to the company (un-risked). BCFnaturalgas and 53.2 The CHPE best estimate for Contingent Resource volumes (2C Development Pending) is 627.4 MMBBL condensate/NGL.
Bcf of naturalgas imported into the EU in the third quarter came from Russia, up two percentage points from the previous quarter and five percentage points against the third quarter of 2023. Twenty percent or 448.5
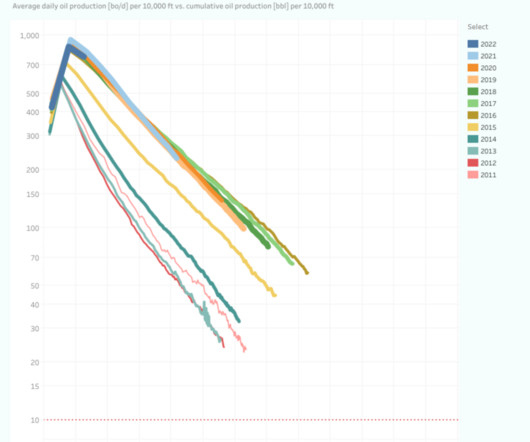
Visit the blog to explore the full interactive dashboard This interactive presentation contains the latest oil & gas production data. This article contains still images from the interactive dashboards available in the original blog post. To follow the instructions in this article, please use the interactive dashboards.
Visit the blog to explore the full interactive dashboard This interactive presentation contains the latest gas (and a little oil). This article contains still images from the interactive dashboards available in the original blog post. To follow the instructions in this article, please use the interactive dashboards.
Read more Naturalgas market struggles to find its footing: here’s why Summary : U.S. naturalgas prices fell nearly 8% last week to $3.249/MMBtu, their lowest since January, despite a smaller-than-expected storage build of 16 Bcf, which was below the five-year average of 50 Bcf. Read more U.S.
May 27, 2025 The Hugh Brinson Pipeline, a major naturalgas infrastructure project led by Energy Transfer LP , continues to move forward as key regulatory approvals are secured. Bcf/d of gas. Bcf/d based on demand. Bcf/d based on demand. Phase I : A 42-inch mainline capable of moving 1.5
NaturalGas & NGL Infrastructure Expansion ONEOK is expanding its naturalgas and NGL (naturalgas liquids) infrastructure in the Permian to capture growing production volumes. This move supports the companys growing gas gathering and processing footprint. Bcf/d in 2025.
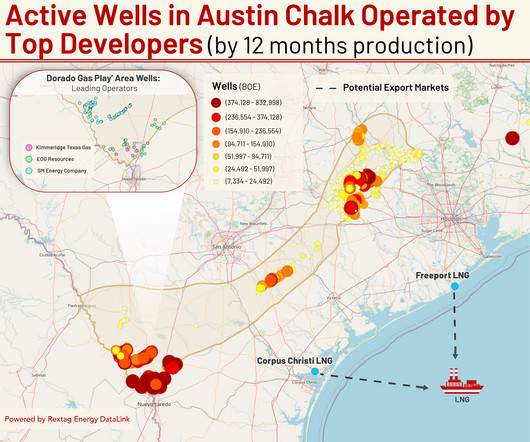
The Austin Chalkan overlying bench above the Eagle Ford Shaleis fast becoming the next big naturalgas growth engine, with operators like EOG Resources, SM Energy, and Magnolia Oil & Gas ramping up development to meet rising LNG demand and domestic needs. billion cubic feet per day (Bcf/d) in 2024 to 7.0
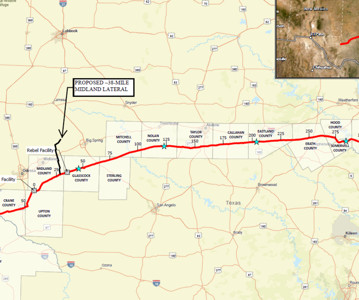
Bcf/d capacity, designed to move naturalgas from the Waha hub in the Permian Basin to Wharton, Texas , with additional delivery capabilities to Katy. share (below consensus estimate of $1.27) Total production: 815,000 boe/d, comprising: Oil: 388,000 bpd NGLs: 203,000 bpd Naturalgas: 1.35
North Americas LNG export capacity is set to triple by 2028, reaching nearly 25 bcf/d, with major projects like Golden Pass and Plaquemines leading the way. And now Albertas proven naturalgas reserves have been reassessed and increased nearly sixfold to 130 trillion cubic feet. Check our full benefits and uses by clicking here.
We organize all of the trending information in your field so you don't have to. Join 5,000+ users and stay up to date on the latest articles your peers are reading.
You know about us, now we want to get to know you!
Let's personalize your content
Let's get even more personalized
We recognize your account from another site in our network, please click 'Send Email' below to continue with verifying your account and setting a password.


Let's personalize your content