This site uses cookies to improve your experience. To help us insure we adhere to various privacy regulations, please select your country/region of residence. If you do not select a country, we will assume you are from the United States. Select your Cookie Settings or view our Privacy Policy and Terms of Use.
Cookie Settings
Cookies and similar technologies are used on this website for proper function of the website, for tracking performance analytics and for marketing purposes. We and some of our third-party providers may use cookie data for various purposes. Please review the cookie settings below and choose your preference.
Used for the proper function of the website
Used for monitoring website traffic and interactions
Cookie Settings
Cookies and similar technologies are used on this website for proper function of the website, for tracking performance analytics and for marketing purposes. We and some of our third-party providers may use cookie data for various purposes. Please review the cookie settings below and choose your preference.
Strictly Necessary: Used for the proper function of the website
Performance/Analytics: Used for monitoring website traffic and interactions
(World Oil) – Citing the latest Current Employment Statistics (CES) report from the U.S. This represented an increase of 600 jobs in the services sector and 1,600 jobs in oil and gas extraction. The top posted job titles for May included maintenance technicians (118), retail cashiers (77), and sales associates (70).
oil and gas drilling activity saw a notable rebound this past week, driven primarily by a surge in natural gas rigs. While oil rig counts continued to slip, steady activity in key basins like the Haynesville and a sharp uptick in states like Kansas signal a potential turning point for upstream operations heading into the second half of 2025.
drilling activity continued to decline last week, marking the sixth consecutive weekly drop in the national rig count—something not seen since late 2023. Oil rigs drove the decline with a loss of 9, while gas rigs rebounded with a gain of 5. June 9, 2025 U.S. Here is a summary of the U.S. Here is a summary of the U.S.
oil and gas sector faced a notable setback this week as the national rig count dropped by seven, bringing the total to 583 active rigsthe lowest level since early 2022. According to the latest Baker Hughes report, oil rigs experienced the steepest single-week decline since June 2023, falling by nine to 480. oil-producing region.
oil and gas sector continues to navigate price volatility and capital discipline, the latest Baker Hughes rig count highlights a steady decline in drilling activity even as production forecasts remain bullish. May 19, 2025 As the U.S. Here’s a snapshot of the current landscape, key state-by-state trends, and what it means for 2025.
oil and gas rig count posted a modest rebound, according to the latest Baker Hughes report. The total rig count rose by two, with both oil and gas rigs each ticking up by one. Rig Count Rises Utica Shale Leads Gains Baker Hughes appeared first on Oil Gas Leads. April 21, 2025 After four consecutive weeks of decline, the U.S.
According to the latest Baker Hughes report, the total number of active oil and gas rigs rose by two to 587, although overall rig activity remains below last year’s levels. Rig Count Rises for Second Consecutive Week Baker Hughes appeared first on Oil Gas Leads. April 28, 2025 U.S.
oil and natural gas rig count experienced its first increase in three weeks, according to the latest Baker Hughes report released on March 21, 2025. The slight recovery in drilling activity comes amid a challenging environment of fluctuating oil and gas prices, ongoing market uncertainties, and shifting priorities among energy companies.
Questions about Ownership and More Who owns the CO 2 , what happens to the remaining oil when that CO 2 is injected into partially depleted oil formations, and how long will there be government money to pay for it? The mystery involves what exactly happens to that oil in the injection and storage process.
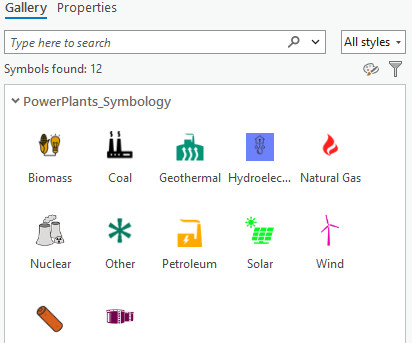
The Shell Standard Symbology 2016 is divided into a Green Oil style and a Red Oil style, both of which are available to download from the Esri Industry Styles content page. The two images below show a snippet of the green and red oil symbology available for use in ArcGIS Pro. Esri (2023) PowerPlants_Symbology. Crameri, F.,
energy firms trimmed the number of active oil and gas rigs, signaling caution amid persistent price pressures and policy uncertainty. Key Takeaways: Oil rigs dropped by four to 479, while gas rigs edged up by two to 101. Rig activity fell by about 5% in 2024 and 20% in 2023. May 5, 2025 For the first time in three weeks, U.S.
We organize all of the trending information in your field so you don't have to. Join 5,000+ users and stay up to date on the latest articles your peers are reading.
You know about us, now we want to get to know you!
Let's personalize your content
Let's get even more personalized
We recognize your account from another site in our network, please click 'Send Email' below to continue with verifying your account and setting a password.


Let's personalize your content